Table of Contents
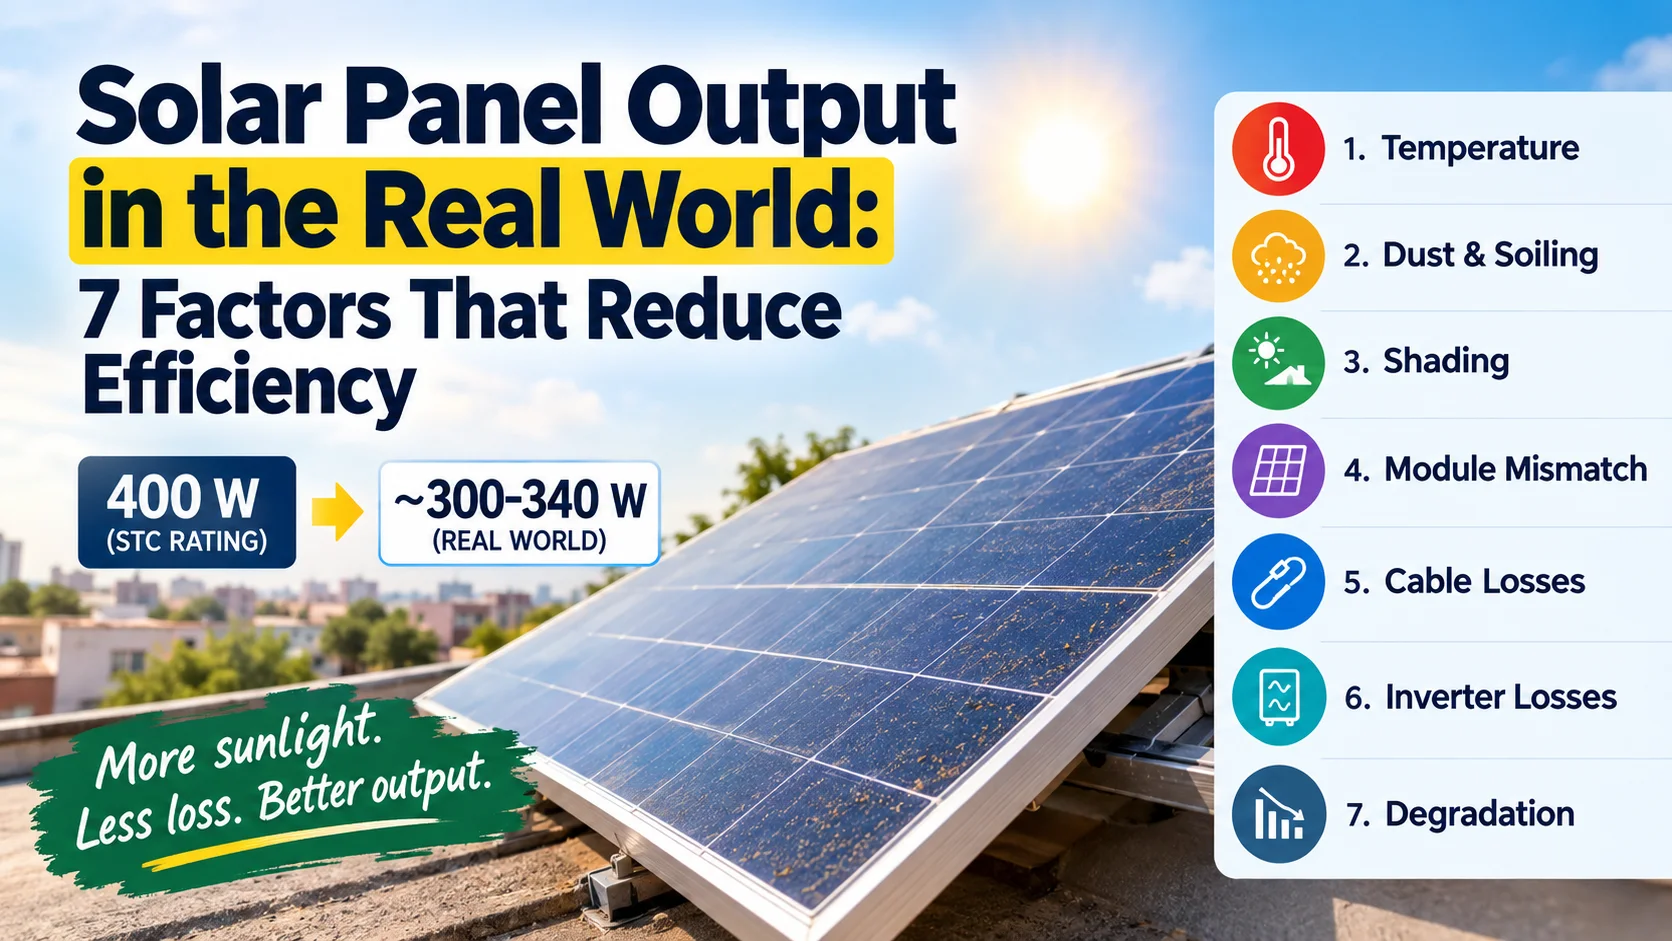
A solar panel rated at 400 W does not necessarily produce 400 W when installed on a rooftop. Its rated power is measured under Standard Test Conditions (STC), which specify a solar irradiance of 1,000 W/m², a solar cell temperature of 25°C, and a defined reference solar spectrum. Actual outdoor conditions rarely match all these requirements simultaneously.
Temperature, shading, dust accumulation, panel orientation, electrical losses, and long-term degradation all influence how much electricity a solar installation generates. Even a well-designed system experiences some losses between the sunlight reaching its panels and the electricity ultimately available to the user.
For homeowners, solar installers, and electrical engineering students, understanding these variables is essential for estimating energy production, comparing solar modules, and identifying opportunities to improve system performance.
In this guide, we will examine the seven major factors affecting solar panel output, explain their effects with practical examples, and show how to estimate the daily and annual energy production of a rooftop solar system.
Quick Answer: Why Do Solar Panels Produce Less Than Their Rated Power?
Solar panels typically produce less power than their nameplate rating under real-world operating conditions because their cells become hotter than the STC reference temperature, sunlight varies throughout the day, and electrical and environmental losses reduce system output.
A useful measure for evaluating the overall performance of a solar installation is the Performance Ratio (PR).
The Performance Ratio describes how much energy a solar system actually delivers relative to the energy it could theoretically produce under the available solar irradiation, after accounting for its rated capacity.
A PR of 0.80, for example, means that the system delivers 80% of the reference energy yield used in the calculation.
A Performance Ratio of approximately 0.75–0.85 can be a reasonable preliminary assumption for many rooftop systems, although actual performance depends on the climate, system design, equipment, maintenance, and measurement period.
Typical Solar System Losses
The following table presents illustrative loss ranges for common sources of energy loss in rooftop solar installations.
| Loss factor | Illustrative loss range | Main contributing factors |
|---|---|---|
| Temperature | 5–12% | Cell temperature, ventilation, module temperature coefficient |
| Soiling | 2–8% | Dust, bird droppings, pollen, rainfall |
| Shading | 0–10% or more | Trees, buildings, water tanks, nearby structures |
| Module mismatch | 1–2% | Differences in module electrical characteristics |
| DC cable losses | 1–2% | Cable length, conductor size, current |
| Inverter conversion | 1.5–3% | Inverter efficiency and operating conditions |
| AC cable losses | Around 1% | Cable length, conductor size, current |
Important: These ranges are indicative rather than universal. They should not be added together indiscriminately to calculate total system losses because actual losses depend on the installation and may interact with one another. Shading, for example, can produce substantially different losses depending on the electrical configuration.
1. Module Efficiency: The Starting Point of Solar Power Generation
Solar panel efficiency represents the percentage of incident solar energy converted into electrical power under specified test conditions.
For example, a module with an efficiency of 22% converts approximately 22% of the solar energy incident on its active module area into electricity under the conditions used to determine that rating.
Commercial crystalline silicon modules commonly achieve efficiencies around 20–23%, although available products and specifications vary.
Higher module efficiency can be particularly valuable when rooftop space is limited. A more efficient panel can generate more power from the same installation area, potentially reducing the number of modules required to reach a target system capacity.
However, module efficiency alone does not determine real-world energy production.
Two panels with similar rated power may perform differently when exposed to high temperatures, partial shading, low-light conditions, or years of outdoor operation.
When comparing solar modules, examine several specifications:
- Rated power (W): The electrical power measured under the manufacturer’s specified test conditions.
- Module efficiency (%): The fraction of incident solar energy converted into electricity.
- Power temperature coefficient (%/°C): The rate at which rated power changes with cell temperature.
- Annual degradation rate (%): The expected reduction in output over time.
- Warranty and durability: The manufacturer’s stated product coverage and performance commitments.
The best choice depends on the available roof area, local climate, installation cost, and expected lifetime energy production—not simply the highest efficiency percentage.
2. Temperature: Why Hot Solar Panels Produce Less Power
Temperature is one of the most important factors affecting solar panel output, particularly in hot climates.
Although sunlight provides the energy required for photovoltaic generation, some of the absorbed energy becomes heat. As a result, solar cells can become considerably hotter than the surrounding air.
For conventional crystalline silicon modules, increasing cell temperature generally reduces voltage and maximum power output.
Manufacturers specify this effect through the power temperature coefficient, usually expressed as a percentage change in rated power per degree Celsius.
For example, a temperature coefficient of −0.35%/°C means that the module’s power decreases by approximately 0.35% for every 1°C increase in cell temperature above the reference temperature, assuming other relevant conditions remain comparable.
Worked Example: A 400 W Solar Panel at Different Temperatures
Consider a 400 W solar panel with a power temperature coefficient of −0.35%/°C.
The reference cell temperature under STC is 25°C.
The percentage power loss can be estimated using:
\text{Power Loss (\%)} = |\gamma_P| \times (T_c - 25)Where:
- (\gamma_P) = power temperature coefficient in %/°C
- (T_c) = actual solar cell temperature in °C
- 25°C = STC reference cell temperature
The estimated output is:
P = P_{\text{STC}}\left[1-\frac{|\gamma_P|(T_c-25)}{100}\right]Where (PSTC) is the rated panel power.
For a 400 W module, the estimated output at different cell temperatures is:
| Cell temperature | Estimated power loss | Approximate output |
|---|---|---|
| 25°C | 0% | 400 W |
| 40°C | 5.25% | 379 W |
| 50°C | 8.75% | 365 W |
| 60°C | 12.25% | 351 W |
| 70°C | 15.75% | 337 W |
These calculations isolate the temperature effect. They assume the same reference irradiance and do not include additional losses from shading, soiling, or electrical equipment.
The results show why a panel rated at 400 W may deliver considerably less power during a hot afternoon.
How Can Temperature Losses Be Reduced?
Although installers cannot control the weather, they can reduce avoidable temperature-related losses.
Practical measures include:
- Provide adequate rear ventilation. Airflow behind the modules helps remove heat.
- Avoid unnecessarily restricting airflow. Mounting arrangements should follow the manufacturer’s installation requirements.
- Choose modules suited to the climate. Compare the actual power temperature coefficients listed on their datasheets.
- Evaluate the complete installation. Roof material, mounting height, wind exposure, and system layout can influence operating temperature.
Temperature Coefficients of Different Solar Technologies
The following ranges are illustrative. Actual values vary between manufacturers and module models, so always consult the relevant datasheet.
| Solar module technology | Illustrative power temperature coefficient |
|---|---|
| Mono PERC | −0.34 to −0.39%/°C |
| TOPCon | −0.29 to −0.32%/°C |
| Heterojunction (HJT) | −0.24 to −0.27%/°C |
A coefficient closer to zero indicates a smaller power reduction as temperature rises.
In hot climates, a module with a lower temperature sensitivity may maintain more of its rated power during high-temperature operation. However, total energy production also depends on module rating, irradiance response, installation conditions, and other characteristics.
3. Panel Orientation and Tilt Angle
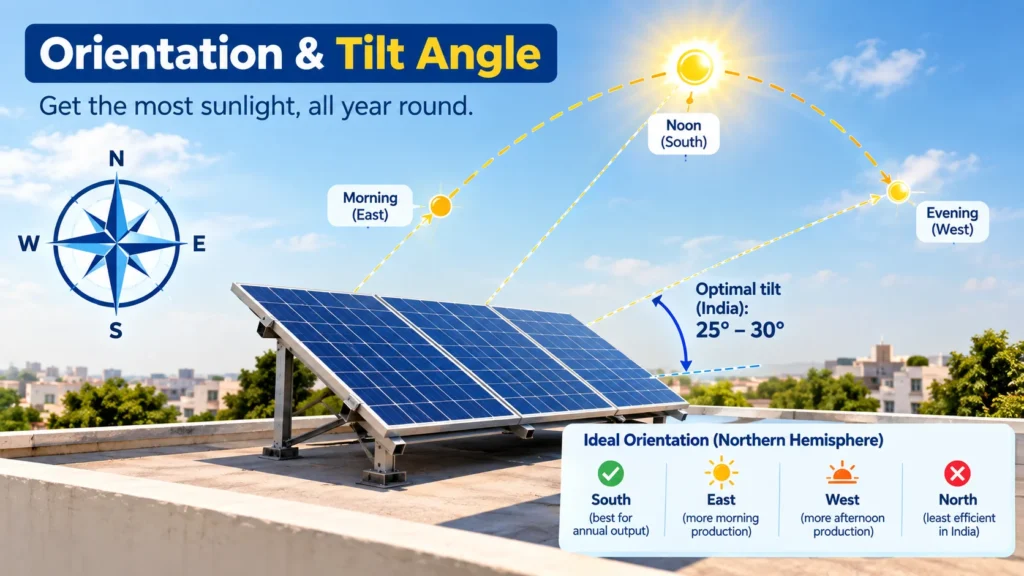
The direction a solar panel faces and the angle at which it is installed determine how much sunlight it receives throughout the day and across the year.
Even a high-efficiency panel can produce less energy than expected if its orientation or tilt is poorly matched to the installation location.
Which Direction Should Solar Panels Face?
In the northern hemisphere, including India, fixed solar panels generally receive strong annual solar exposure when oriented toward the south.
However, the ideal orientation depends on the site’s location, roof geometry, nearby obstructions, and the time of day when electricity is most valuable.
For example:
- South-facing panels: Often suitable for maximizing annual energy production with a fixed installation.
- East-facing panels: Tend to generate a larger share of their daily electricity earlier in the day.
- West-facing panels: Tend to generate a larger share of their daily electricity later in the afternoon.
- North-facing panels: May produce less annual energy in many locations in India, depending on the roof pitch and local solar conditions.
Orientation should therefore be selected according to the intended use of the electricity, not just the total number of annual kilowatt-hours.
What Is the Ideal Solar Panel Tilt Angle?
For a fixed installation, a tilt angle near the site’s latitude is a useful starting point for estimating an annual-energy-oriented configuration. It is not a universal optimum, and the best angle can differ depending on seasonal priorities and local conditions.
For many locations in northern India, a tilt in the approximate range of 25–30° can serve as an initial design estimate. A site-specific calculation is preferable.
Roof-mounted systems may use a different angle to accommodate the existing roof, structural constraints, wind loading, or installation costs.
To estimate the solar energy available at a particular location and explore system configurations, use the free NREL PVWatts calculator:
Calculate Solar Energy Production Using NREL PVWatts
For a practical installation, consider the roof’s orientation and tilt together with seasonal shading, local weather, and household electricity demand.
4. Shading: A Small Obstruction Can Cause a Large Power Loss
Shading is among the most important factors to assess before installing rooftop solar panels.
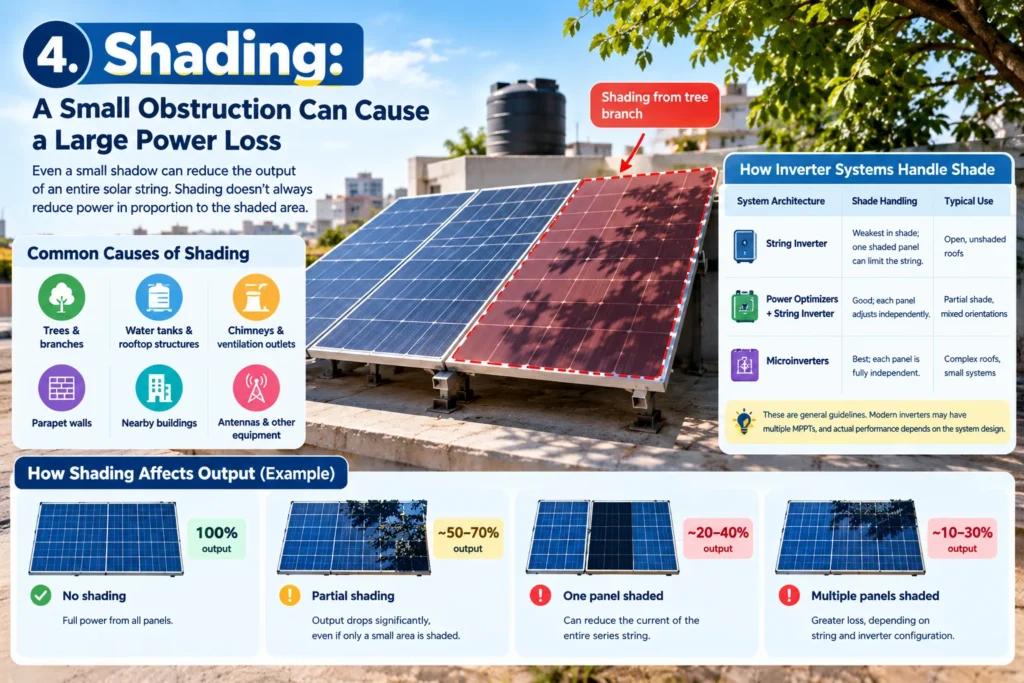
Unlike some other losses, shading does not always reduce power in direct proportion to the shaded area.
Solar cells within a module are electrically interconnected, and modules are often connected in series to form a string. In a series circuit, current is constrained by the electrical characteristics of the connected components.
When part of a module is shaded, its affected cells can restrict current. Bypass diodes help limit the impact by allowing current to bypass certain groups of cells under appropriate conditions, but this can reduce the module’s available voltage and power.
The actual loss depends on the shading pattern, module design, string configuration, inverter architecture, and operating conditions.
Common Causes of Solar Panel Shading
The most common sources of rooftop shading include:
- Trees and growing branches
- Water tanks and rooftop structures
- Chimneys and ventilation outlets
- Parapet walls
- Nearby buildings
- Antennas and other rooftop equipment
Shading can also change throughout the year as the sun’s position changes and trees grow.
A roof that appears unshaded during a midday inspection may experience significant shading in the morning, late afternoon, or winter months.
For this reason, a proper site assessment should consider shading across different times of day and seasons.
How Different Inverter Systems Handle Shading
The electrical architecture of a solar installation influences how shading affects energy production.
| System architecture | How it handles shading | Typical application |
|---|---|---|
| String inverter | Modules in a string share electrical operating constraints, so shading can affect string output | Relatively uniform, minimally shaded roofs |
| String inverter with power optimizers | Module-level electronics can reduce the impact of differences between modules | Roofs with partial shading or different orientations |
| Microinverters | Each module has its own inverter, reducing direct electrical interaction between modules | Complex roof layouts and installations with varying module conditions |
These descriptions are general rather than absolute. Modern string inverters may include multiple maximum power point trackers (MPPTs), and the performance of any architecture depends on the particular equipment and system design.
Power optimizers and microinverters can increase installation costs. Their additional energy production and operational benefits should be compared with the extra upfront expense.
Practical tip: Before installation, identify shading from nearby structures and trees. Preventing avoidable shading can be more effective than trying to compensate for it after the system is installed.
5. Dust, Dirt, and Other Soiling Losses
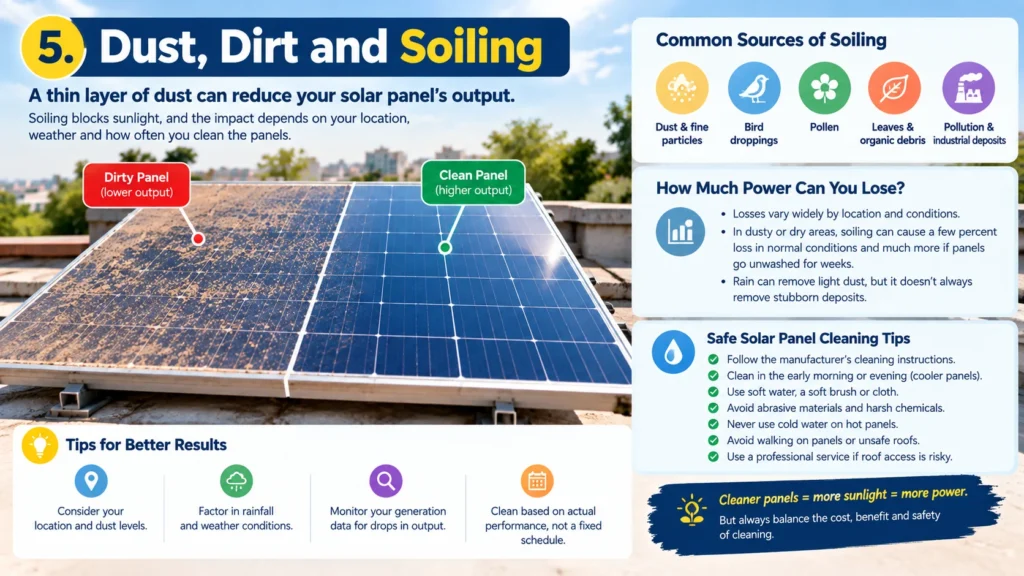
Solar panels need access to sunlight, but outdoor installations inevitably accumulate dust and other material on their surfaces.
This accumulation is known as soiling.
Common sources include:
- Dust and fine airborne particles
- Bird droppings
- Pollen
- Leaves and organic debris
- Pollution and industrial deposits
Soiling reduces the amount of sunlight reaching the photovoltaic cells. Its impact depends on the amount and type of deposited material, local weather, rainfall, panel tilt, and cleaning frequency.
In dusty or dry regions of India, accumulated dirt can noticeably reduce energy production, particularly during extended periods without rain.
Rain can remove loose dust, but it does not always eliminate stubborn deposits or prevent uneven dirt accumulation.
How Much Power Can Dirty Solar Panels Lose?
There is no single percentage that applies to every installation.
A system exposed to frequent rainfall may experience relatively low soiling losses, while a system near a dusty road or construction site may accumulate deposits more quickly.
Bird droppings and other localized deposits can also cause disproportionate losses when they shade electrically significant portions of a module.
Rather than following a fixed cleaning schedule without considering conditions, compare actual generation with expected performance and inspect the panels periodically.
Safe Solar Panel Cleaning Practices
Use the following precautions when cleaning a solar installation:
- Follow the module manufacturer’s cleaning instructions.
- Clean during cooler conditions, such as early morning, when practical.
- Use an appropriate soft brush or cloth and suitable water.
- Avoid abrasive materials and cleaning chemicals that could damage the glass or module surface.
- Never pour cold water onto very hot panels.
- Avoid walking on modules or climbing onto unsafe roofs.
- Use a qualified cleaning service when roof access creates a fall risk.
Cleaning should be based on the expected recovery in energy production, local conditions, and the cost and safety of the work.
6. Inverter Efficiency and Electrical Wiring Losses
Solar modules generate direct current (DC), while most household appliances and the electricity grid use alternating current (AC).
An inverter converts the DC electricity generated by the panels into AC electricity suitable for the intended application.
During this conversion, some energy is lost as heat and through other internal processes.
Modern inverters can achieve conversion efficiencies of approximately 97–98.5% under suitable operating conditions, although actual efficiency depends on the model, load, temperature, and other operating variables.
An inverter’s maximum efficiency should not automatically be assumed for every hour of operation.
DC Cable Losses
Electric current flowing through a conductor encounters electrical resistance. This produces power loss, which can be expressed as:
P_{\text{loss}} = I^2 RWhere:
- (Ploss) = power dissipated as heat in watts
- (I) = current through the conductor in amperes
- (R) = electrical resistance in ohms
Resistance increases with conductor length and decreases as conductor cross-sectional area increases, assuming the same material and temperature.
Consequently, unnecessarily long or undersized cables can increase power losses.
AC Cable Losses
Similar resistive losses occur on the AC side of the inverter.
Cable losses depend on conductor resistance, current, circuit length, and the electrical configuration. In AC systems, voltage drop and power calculations may also require consideration of power factor and reactance.
Correct cable sizing helps limit energy losses and maintain voltage within the applicable design requirements.
Why Installation Quality Matters
In addition to energy efficiency, electrical installation quality affects system safety.
Loose terminals, poor crimps, damaged insulation, and unsuitable connectors can cause overheating and equipment failure. Under certain conditions, these defects can create a fire hazard.
A properly designed installation should therefore include:
- Appropriate DC and AC cable sizing
- Compatible connectors and correctly executed terminations
- Suitable overcurrent and surge protection
- Correct grounding and earthing arrangements
- Compliance with applicable electrical and installation requirements
Equipment selection matters, but installation quality is equally important.
7. Solar Panel Degradation: Understanding Long-Term Output
Solar panels do not maintain exactly the same power output throughout their service life.
Exposure to sunlight, temperature cycling, humidity, and other environmental stresses can gradually reduce their output.
This long-term reduction is known as degradation.
Manufacturers generally provide product warranties and power-performance warranties that specify coverage periods and guaranteed performance levels. The actual warranty terms vary by product.
For many contemporary modules, long-term power warranties extend to approximately 25–30 years. Some products specify guaranteed output in the range of 84–88% at the end of the warranty period, although these figures should never be assumed to apply to every panel.
An annual degradation rate around 0.4–0.55% can be used as an illustrative planning assumption for some modules. Actual rates vary by technology, manufacturing quality, climate, and operating conditions.
Example: How Panel Output Changes Over 25 Years
Assume a module begins at 100% of its initial rated output and experiences a constant annual degradation rate of 0.5%, compounded each year.
The remaining output can be estimated using:
P_n = P_0(1-d)^n
Where:
- (P_n) = estimated output after (n) years
- (P_0) = initial output
- (d) = annual degradation rate expressed as a decimal
- (n) = number of years
For a degradation rate of 0.5%, (d=0.005).
The estimated remaining output is:
| Year | Remaining output relative to initial output |
|---|---|
| 1 | 99.5% |
| 5 | 97.5% |
| 10 | 95.1% |
| 15 | 92.8% |
| 20 | 90.5% |
| 25 | 88.2% |
These values use a simplified constant-rate model. Actual degradation may not be uniform, and manufacturer warranties may use different calculation methods.
The important point is that solar output changes gradually over time.
When comparing modules, consider the initial power rating alongside the warranty, expected degradation, temperature coefficient, and installed cost.
A module with a slightly lower initial rating may deliver competitive lifetime energy production if its other performance characteristics are favorable.
How to Estimate Real-World Solar Panel Output
The factors discussed above can be combined into a practical energy-production estimate.
A useful preliminary formula is:
E = P_{\text{system}} \times H_{\text{sun}} \times PRWhere:
- (E) = estimated daily energy production in kWh
- (Psystem}) = installed DC capacity in kW
- (Hsun) = equivalent peak sun hours per day
- (PR) = Performance Ratio expressed as a decimal
Peak sun hours represent the daily solar irradiation expressed as an equivalent number of hours at a reference irradiance of 1 kW/m².
They are not the same as the number of daylight hours.
The Performance Ratio accounts for the difference between the theoretical reference yield and the actual system yield, including relevant temperature, inverter, wiring, soiling, shading, and other losses according to the calculation method used.
Worked Example: Daily Energy from a 5 kW Solar System
Suppose a rooftop solar system has the following characteristics:
- Installed DC capacity: 5 kW
- Average equivalent peak sun hours: 5 hours per day
- Assumed Performance Ratio: 0.78
Using the formula:
E = 5 \times 5 \times 0.78
\boxed{E = 19.5 \text{ kWh/day}}Estimated annual energy production, assuming the same daily average throughout the year, is:
E_{\text{annual}}=19.5\times365E_{\text{annual}}=7,117.5\text{ kWh/year}The result is approximately 7,120 kWh per year.
This is an illustrative estimate, not a production guarantee. Actual monthly and annual output will depend on location, seasonal weather, system orientation, shading, equipment, and maintenance.
How Performance Ratio Affects Annual Solar Generation
Consider the same 5 kW system with an assumed average of 5 peak sun hours per day.
Different Performance Ratios produce different estimated energy yields.
| Performance Ratio | Estimated daily energy | Estimated annual energy |
|---|---|---|
| 0.70 | 17.5 kWh | 6,388 kWh |
| 0.78 | 19.5 kWh | 7,118 kWh |
| 0.85 | 21.25 kWh | 7,756 kWh |
Annual figures are calculated using 365 days and rounded to the nearest kWh.
The difference between the 0.70 and 0.85 scenarios is approximately 1,370 kWh per year.
This demonstrates why seemingly small differences in overall system performance can have a meaningful effect on annual energy production.
Where Can You Find Solar Irradiation Data?
Solar irradiation varies across India and changes with the season.
For a reliable estimate, use location-specific solar resource information rather than assuming the same peak sun hours for every city.
Useful resources include:
- NREL PVWatts Calculator — estimates photovoltaic energy production for a specified location and system configuration.
- Ministry of New and Renewable Energy (MNRE) — India’s official ministry for new and renewable energy information.
For an actual installation, use a suitable site-specific assessment and account for monthly variations rather than relying exclusively on a single annual-average estimate.
Why Monitoring Solar Panel Output Matters
Installing solar panels is only the first step. Monitoring their energy production helps determine whether the system continues to perform as expected.
Most modern inverters provide monitoring through a mobile application, web portal, or local display.
Depending on the system, monitoring may show:
- Current power generation in watts or kilowatts
- Daily energy production in kWh
- Monthly and annual energy totals
- Inverter operating status
- Individual string or module performance, when supported
How to Identify a Drop in Solar Generation
A reduction in output does not automatically mean that a panel or inverter has failed.
Cloud cover, seasonal changes, dust accumulation, shading, and temperature can all affect generation.
To identify a potential fault:
- Compare generation with the expected output for similar weather conditions.
- Review the daily and monthly production trends.
- Check for new shading or visible dirt accumulation.
- Look for inverter warnings or fault messages.
- Have a qualified technician investigate persistent or unexplained underperformance.
Comparing the current month with the previous month alone can be misleading because solar irradiation and daylight duration change throughout the year.
Monitoring is most useful when actual generation is compared with an appropriate expected-yield estimate.
Conclusion
Solar panel output depends on much more than the rated wattage printed on a module.
Temperature, orientation, shading, soiling, inverter efficiency, wiring, and long-term degradation all influence how much electricity a solar installation generates.
For accurate system planning, begin with the module datasheet and local solar resource data. Evaluate shading and orientation before installation, select appropriately rated electrical components, maintain the panels safely, and monitor energy production over time.
Most importantly, distinguish between instantaneous power, measured in watts, and electrical energy, measured in kilowatt-hours. A panel’s rated power describes its output under specified test conditions, while daily and annual energy production depend on the sunlight available and the performance of the complete system.
Understanding these factors helps homeowners make more realistic generation estimates and enables electrical engineering students to connect photovoltaic theory with actual system behavior.
Frequently Asked Questions About Solar Panel Output
Why does my solar panel produce less than its rated capacity?
A solar panel’s rated capacity is measured under Standard Test Conditions, including a cell temperature of 25°C and an irradiance of 1,000 W/m².
Outdoor conditions differ from these test conditions. Higher cell temperatures, changing sunlight, shading, soiling, wiring losses, and inverter conversion losses can all reduce actual output.
A panel rated at 400 W may therefore deliver substantially less than 400 W at a particular moment without being defective.
What percentage of rated solar capacity can I expect in real-world conditions?
There is no single percentage that applies to every installation.
For preliminary planning, a Performance Ratio of approximately 0.75–0.85 can be a reasonable assumption for many rooftop systems. The actual value depends on local climate, equipment, system design, shading, maintenance, and the period being evaluated.
Remember that Performance Ratio is a measure of energy yield relative to the available solar resource, not a guarantee that a panel will continuously operate at a particular percentage of its rated power.
Does a higher-efficiency solar panel always generate more electricity?
No. Higher module efficiency means more electrical power can be generated per unit of module area under the specified test conditions.
However, total energy production also depends on rated capacity, temperature sensitivity, orientation, shading, soiling, inverter performance, and degradation.
When roof space is limited, higher-efficiency modules can be particularly useful. When space is sufficient, compare installed cost and expected energy production rather than choosing solely by efficiency percentage.
How often should solar panels be cleaned?
The ideal cleaning frequency depends on local dust levels, rainfall, nearby construction, bird activity, panel tilt, and the observed effect of soiling on energy production.
Some installations may need cleaning relatively frequently, while others remain adequately clean for longer periods.
Inspect panels periodically and use monitoring data to determine whether cleaning is likely to improve production enough to justify its cost. Follow the manufacturer’s cleaning instructions and use safe roof-access practices.
Is lower solar panel output in summer normal?
Yes, under some conditions.
Longer daylight hours and strong sunlight can increase daily energy production, but high cell temperatures reduce the instantaneous power output of conventional crystalline silicon modules.
The overall daily result depends on the balance between solar irradiation, temperature, weather, and other system losses. A hot day does not automatically mean lower total daily energy production.
Can shade from a single tree affect an entire solar installation?
Yes, depending on the shading pattern and electrical configuration.
When modules are connected in a series string, shading on one module can affect the operating current of the string. Bypass diodes and module-level power electronics can reduce some of these effects, but they do not eliminate every shading loss.
A proper shading assessment should consider the timing, duration, and location of the obstruction.
How long do solar panels maintain their original output?
Solar panels gradually lose output over time, with the rate depending on the module technology, manufacturing quality, environmental conditions, and operating history.
Many manufacturers provide performance warranties extending to approximately 25–30 years. The guaranteed end-of-warranty output varies by product, so check the actual warranty documentation rather than assuming a universal degradation rate.